figure 1: The set up used in experiments 1, 2 and 3
Chapter 6
How
flexible is the self-motion perceptual system?:
introducing phase and amplitude differences between visual and proprioceptive
passive linear horizontal self-motion stimuli
B.S.Mesland, W.Bles, P.Werkhoven and A.H.Wertheim
Introduction
In normal everyday life, a coherent percept of self-motion somehow results from integration of the information obtained from the visual system and from the proprioceptive receptor system (vestibular, kinaesthetic etc.), and these two systems are closely related (see e.g. Dichgans and Brandt 1972; Berthoz et al. 1975; Young and Henn 1974).
From laboratory experiments we know, that stimulation of only the visual system or only the proprioceptive system often leads to an inadequate self-motion sensation. For example, short-lasting linear acceleration stimuli acting on the proprioceptive system may, even in the absence of visual motion information, result in a correct motion sensation. But in the absence of such visual stimulation a sustained linear horizontal acceleration results in a sensation of tilt as the observer interprets the resultant GIF-vector (the gravito-inertial force vector) as the gravitational vertical (Guedry, 1974; see also chapter 5). As we have seen in the prior chapter, tilt sensations may also be reported in the absence of visual information, during linear horizontal sinusoidal motion with low maximum accelerations at motion frequencies around 0.2 Hz.
With vision it is the other way around: long lasting visual linear motion information will result in a steady sensation of linear ego motion (usually called linear vection), but too brisk stimulus onsets (i.e. high accelerations and decelerations) yield sensations of surround motion before ego-motion is experienced (Berthoz et al. 1975).
The visual and proprioceptive systems both register actual self-motion. However, vision also acts as a form of expectation, enabling an observer to 'look ahead'. One can see whether the way ahead is horizontal or not before having been there. The proprioceptive system cannot do this, and provides no information on future ego motion. Therefore one can say that one expects to feel what one sees, rather than expecting to see what one feels. Hence, it seems plausible that the role of the visual system in self-motion perception is dominant. That is, if a discrepancy arises between proprioceptive and visual ego-motion information, a certain unwillingness to disregard visual information may be expected.
Different investigators, who presented conflicting visual/proprioceptive information, showed that in the perception of self-motion, there is a dominance of visual over proprioceptive information (Lishman and Lee 1973; Berthoz et al. 1975; Bles and de Jong 1981; Young et al. 1973; Carpenter-Smith et al. 1995; Howard and Childerson 1994). There is much less evidence for the opposite: a dominance of the proprioceptive systems over the visual system in perceived self-motion (Young et al 1973; Young et al. 1975; Berthoz and Pavard 1977).
The immidiate proprioceptive response to sudden motion onsets can be conceptualized as the output from a high pass filter in the proprioceptive domain. Conversely, the much slower development of the linear vection response to a sudden onset of optic flow, can be conceptualized as the output from a low pass filter in the visual domain. Depending on the frequency of the visual/proprioceptive information a bigger or smaller range of conflicting stimuli may be perceived as veridical motion until a threshold is reached and one becomes disoriented. What happens when our central perceptual system detects a discrepancy between visual and proprioceptive self-motion information? There appear to be 2 different perceptual possibilities: one may become confused or somehow disoriented as to how one moves, or the surrounding world may seem to become unstable and appear to move. In addition, motion sickness may occur, because a discrepancy between visual and proprioceptive selfmotion stimuli is known to generate motion sickness in many cases (see e.g. Reason and Brandt, 1978).
For the purpose of the present investigation disorientation is defined as: noticing something strange about one's self-motion whilst being unable to point out what it is that is strange about it. Therefore it will not be labeled disorientation when one perceives that the surrounding world becomes unstable, because in that case it is quite clear what it is that is strange. Disorientation is thus most likely to occur within the range of percepts bounded on one side by veridical self motion percepts and on the other side by percepts of an unstable surround.
In the following series of experiments it was tried to establish the combinations of passive linear horizontal oscillation and simulated visual oscillation that would yield a veridical self-motion percept. This was done by systematically manipulating the gain and phase relationship between the simulated visual motion and the proprioceptive ego motion at different frequencies. Thus, the approximate thresholds for sensing desorientation or perceiving motion of the environment were measured.
Experiment 1
Linear horizontal self-motion perception in a virtual room
Method
Ten paid naive subjects (aged 18-30 yrs) participated in the experiment. Pilot studies taught us that our experimental set-up could provoke motion sickness. Therefore, to avoid premature quitting of the experiment due to motion sickness, subjects were selected on the basis of their own account of not being susceptible to motion sickness. They gave their informed consent and were free to withdraw at any time.
Passive linear horizontal whole body oscillation in the X-direction was produced by seating the subject on a linear horizontal accelerator called 'the sled' (see Soons et al, 1982 for details about the ESA sled) (see also fig 1). The subject was strapped into a 5 point safety belt and the head and neck were supported by a comfortable restraint. Sounds produced by the sled's motor were masked by white noise, which the subject heard through headphones. Air-flow cues were prevented by a heavy cloth surrounding the sled's seat. The subject and experimenter communicated via head-phones and attached microphone. This communication was recorded continuously on cassette-recorder.
figure 1: The set up used in experiments 1, 2 and 3
The virtual visual environment was created by an ESIG-2000 pattern generation computer system. The simulated environment consisted of a virtual room, proven to be quite realistic in earlier virtual environment immersion experiments (Werkhoven and Kooi, 1994). It was presented to the subjects on a monitor placed (on a rigid frame, attached to the sled's chair) 15 cm from the subject's eyes. The subject was wearing prismatic spectacles with +8 diopters positive lenses. This created an almost full field visual environment without the need to accomodate.
The virtual room mimicked an existing room in our institute (5.4m x 5.2m x 2.4m). The starting position of the subject relative to the facing wall was always 5.1 m. To prevent that one would "hit" this facing wall, the maximum length of the ego motion path was 5 m. The floor was covered with 24.5cm x 24.5cm black and white tiles. The distance from the subject to the right and left hand side walls was 1.25m and 4.15m respectively. Between the ego motion path and the left hand side wall a virtual workstation was located, 0.8m to the left of the subject (see Fig. 2).
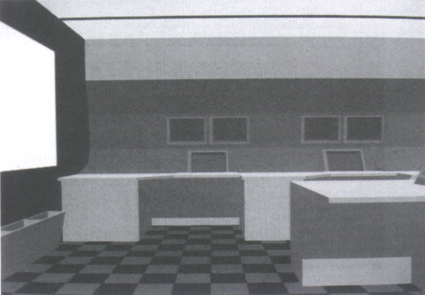
figure 2: The virtual room, as seen by the subject
By using the output position signal from the sled as an input signal to the computer, the motion of the virtual environment was (de)synchronized with the motion of the subject on the sled. By introducing time delays the phase relationship between the visual and proprioceptive stimuli could be varied. The gain relationship between the visual and proprioceptive stimuli could be varied by changing the amplitude of the visual motion stimulus whilst keeping the proprioceptive stimulus constant.
Subjects were oscillated sinusoidally along their X-axis at two different frequencies: 0.18 Hz and 0.36 Hz, with equal maximum accelerations of 0.2g, and peak to peak displacements (p-p displacements) of 3.2m and 0.8m respectively. They will be referred to as Low frequency (L) and High frequency (H) respectively (see Table 1).
Table 1: standard sinusoidal motion profiles
|
frequency |
max. acceleration |
max. velocity |
max. amplitude |
|
0.18 Hz (L) |
0.2 g |
1.81 m/s |
1.64 m |
|
0.36 Hz (H) |
0.2 g |
0.90 m/s |
0.40 m |
With each of the two presented motion profiles either the amplitude- (A) or the phase- (Ph) relationship between the visual and the proprioceptive stimulus was varied. When the amplitude was varied the phase relationship was kept constant at 0 degr. When the phase was varied the amplitudes of the visual and prorioceptive stimuli were kept equal. Thus, a total of four condition blocks was offered to the subjects (see Table 2).
Table 2: condition blocks of Experiment I
|
|
Variable Amplitude |
Variable Phase |
|
0.18 Hz (Low) |
Block LA |
Block LPh |
|
0.36 Hz (High) |
Block HA |
Block HPh |
In the A conditions we used the term Stimulus Ratio to denote the p-p displacement of the visual motion profile divided by the p-p displacement of the sled motion profile. In the HA condition 6 Stimulus Ratios were used: 0.25, 0.5, 1.0, 1.5, 2.0 and 3.0 (corresponding to visual virtual p-p displacements of 0.2, 0.4, 0.8, 1.2, 1.6 and 2.4 m respectively). In the LA condition 5 Stimulus Ratios were used: 0.25, 0.5, 1.0, 1.25 and 1.5 (corresponding to visual virtual p-p displacements of 0.8, 1.6, 3.2, 4.1 and 4.8 m respectively). In the latter condition the maximum ratio of 1.5 is dictated by the length of the virtual room, which is only 5 m (see Fig.1).
In each A condition every Stimulus Ratio was presented 3 times in random order. Thus, the total number of presentations in condition HA was 6 * 3 = 18, and in condition LA was 5 * 3 = 15.
In the Ph conditions 9 different phases of the visual stimulus relative to the proprioceptive stimulus were used. In both the LPh and the HPh condition the presented phases were: -40, -30, -20, -10, 0, 10, 20, 30 and 40.
Each phase was presented 3 times in random order. Therefore, the total number of visual presentations was 9 * 3 = 27 in both the LPh and HPh condition.
In both the A and the Ph conditions each stimulus presentation lasted until the subject had answered the following two questions:
During the intervals in between presentations subjects closed their eyes.
The number of times out of 3 identical Phase or Stimulus Ratio presentations, that a subject's answer to question 1 was that 'motion seemed normal', was taken as that subject's N(ormal)-score for that particular Stimulus Ratio or Phase. Thus N-scores could vary from 0 (every presentation seemed strange) to 3 (every presentation seemed normal).
Similarly, the number of times out of 3 presentations, that a subject's answer to question 2 was that 'the room was stable' and did not appear to move in space, was taken as that subject's S(table)-score for that particular stimulus. Thus S-scores could vary from 0 (the environment seemed to move at every presentation) to 3 (the room seemed stable at every presentation). For each Phase and Stimulus Ratio the group mean N- and S-scores were calculated and expressed as a percentage of the total of 3 presentations. The scores thus indicate the average incidence of 'normal' percepts and 'earth-stable environment' percepts for a particular Phase or Stimulus Ratio.
The 4 conditions were balanced between subjects. A condition never lasted more than 20 minutes and they were completed during the course of one day, with long breaks in between. Subjects were instructed to inform the experimenter about their well being during the runs and measurements would immediately be stopped upon request. In the latter case the subject was released and returned to the waiting room to recover. After recovery an attempt would be made to continue, if possible, with a different (less provocative) condition. If necessary the number of presentations was reduced to a minimum by choosing only the Phases or Stimulus Ratios that seemed, according to the answers, to contain the most information. In the A conditions extra (bigger or smaller) Stimulus Ratios were sometimes added if minimum or maximum N-scores seemed to lie outside the presented range of Stimulus Ratios.
Results
Motion Sickness
In spite of our selection efforts 8 of the 10 subjects experienced a certain degree of motion sickness during the experiment, varying from stomach awareness to nearly vomiting. The Ph subconditions seemed to be most provocative. Subject 10 experienced such severe motion sickness that he had to quit the experiment during the first block. Subject 6 could only complete the LA blocks. Subjects 1, 4 and 7 did not finish the Ph subconditions because of motion sickness, but completed the LA and HA blocks. Three subjects (2, 3 and 8) reported stomach awareness during large phase difference subconditions in the LPh and HPh blocks, but were able to complete the entire experiment. All together this reduced the data set for the LPh and HPh blocks to 5 subjects.
A conditions
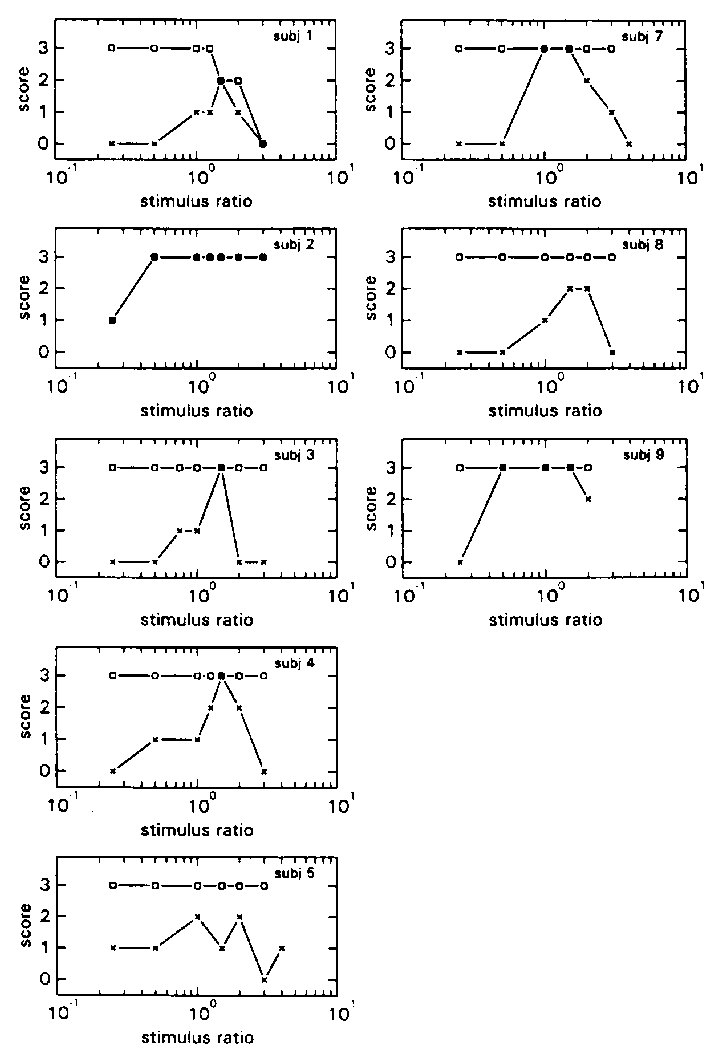
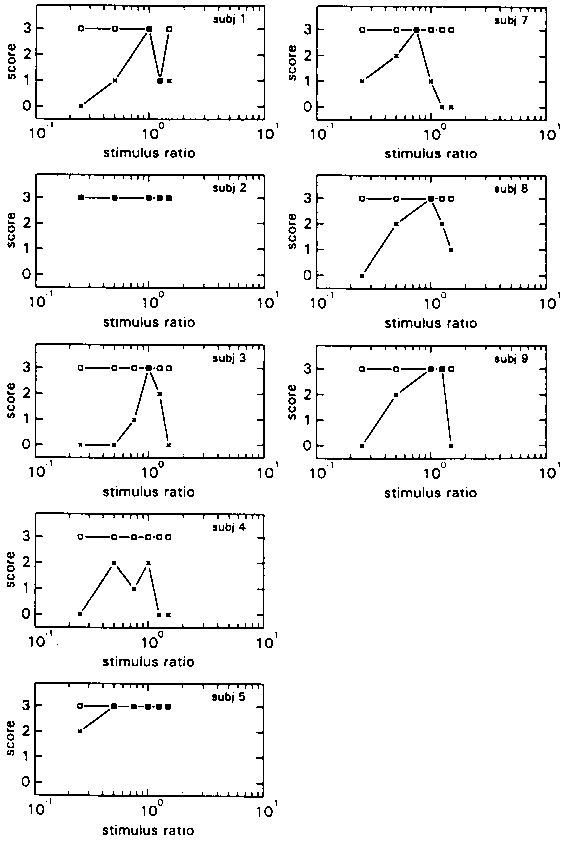
figure 3: Individual N-scores (x) and S-scores (R), in the HA blocks (a) and LA blocks (b), plotted as a function of stimulus ratio of the various stimulus combinations. N-scores vary from 0 (there was always something abnormal) to 3 (everything was always normal); S-scores also vary from 0 (the virtual room was never perceived as stable) to 3 (it was always perceived as stable).
To demonstrate the individual differences in the perceived quality of the self-motion the individual N- and S- scores of conditions HA and LA are shown in Fig 3a and 3b. With respect to the N-scores, some subjects scored 3 (selfmotion seemed normal at every presentation) at only one Stimulus Ratio, whereas others scored 3 on a range of 2 to 6 Stimulus Ratios. There were also subjects who never scored 3.
The individual S-scores reveal that almost all subjects scored 3 on all the presented Stimulus Ratios (thus the room was practically always perceived as stable).
Remarkable was that almost every subject was able to report exactly what it was that was strange about their motion. They reported that their proprioceptively felt velocity was smaller than their visual flow, or that it was the other way around.
Figure 4 shows the group average N- and S-scores. N-scores in the HA block reach their maximum when the p-p displacement of the visual stimulus is 1.5 times that of the proprioceptive stimulus. In block LA the N-scores reach their maximum at a stimulus ratio of 1, that is when visual and proprioceptive inputs are congruent.
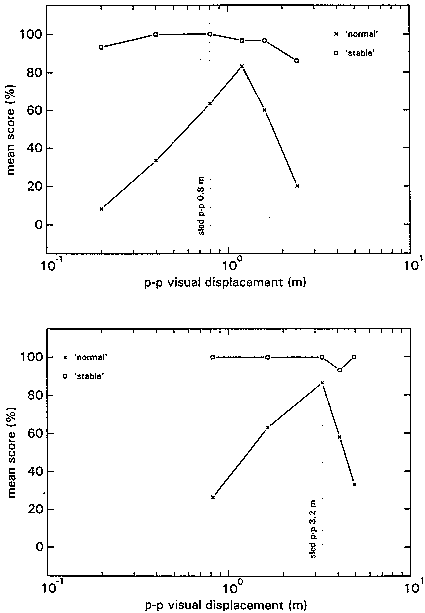
figure 4: Group mean N-scores (x) and S-scores (R), in the HA blocks (upper panel) and LA blocks (lower panel), plotted as a function of the p-p displacement of the visual stimulus at the various stimulus combinations. N-scores vary from 0% (there was always something abnormal) to 100% (everything was always normal); S-scores also vary from 0% (the virtual room was never perceived as stable) to 100% (it was always perceived as stable).
Ph conditions
The individual N- and S-scores of condition HPh and LPh are shown in Fig. 5 as a function of the phase of the visual stimulus relative to the proprioceptive stimulus. Individiuals are again quite different in the amount of times they score a Phase as 3 (veridical motion percept). As can be seen two subjects reported motion of the environment in both conditions (subject 3 reported environment motion once in condition HPh, but only at an extreme phase difference of 60 deg). Note that the S-scores of subject 2 are equal to the N-scores. This implies that whenever self-motion seemed strange, the environment became unstable. The first reports of instability of the environment of subject's 3 and 8, are at phase differences bigger than those which yielded the first reports of desorientation.
figure 5: Individual N-scores (x) and S-scores (R) in the HPh blocks (left) and LPh blocks (right), as a function of the phase shift of the visual stimulus relative to the proprioceptive stimulus. N-scores vary from 0 (there was always something abnormal) to 3 (everything was always normal); S-scores vary also from 0 (the environment was never perceived as stable) to 3 (the environment was always perceived as stable).
Group average N- and S-scores revealed a similar score pattern in the HPh condition as in the LPh condition, as illustrated in Fig 6. A higher tolerance for phase leads than for phase lags of the visual stimulus relative to the proprioceptive stimulus is revealed. The maximum of the group mean N- and S-scores seems to lie somewhere in between a 0 deg phase lead and a 10 deg phase lead.
figure 6: Group mean N-scores (x) and S-scores (R) in the HPh blocks (upper panel) and LPh blocks (lower panel), as a function of the phase shift of the visual stimulus with respect to the proprioceptive stimulus. N-Scores vary from 0% (there was always something abnormal) to 100% (everything was always normal); S-scores vary also from 0% (the environment was never perceived as stable) to 100% (the environment was always perceived as stable).
Discussion
Phase shifts between the visual and proprioceptive stimuli provoked much more motion sickness than amplitude differences. It could be that this is due to the fact that there were simlpy more stimulus presentations in the Ph conditions (27) than in the A conditions (18 and 15). But half of the subjects aborted the Ph conditions due to motion sickness already after 7-10 presentations. Since this is less than the number of stimuli presented in both A conditions, the stimuli themselves must have caused the difference. Apparently phase differences between visual and proprioceptive stimuli are more provocative than amplitude differences.
The results of the A conditions revealed a difference in the average Stimulus Ratio that resulted in the highest percentage of 'normal' percepts. In the LA condition this ratio was 1 whereas in the HA condition it was 1.5. In addition, most of the subjects were able to describe what was strange about their motion when they reported 'strange' percepts. Thus, if we stick with our definition of disorientation as stated in the introduction, we must conclude that subjects were hardly ever disoriented in the A conditions. This may explain the low incidence of motion sickness in the A conditions. Apparently in the A conditions it was possible for subjects to separate what they were feeling from what they were seeing. It seems that they were simply tryong to match the proprioceptive stimulus to the visual stimulus. With this in mind the difference between condition HA and LA in the Stimulus Ratio that was perceived as most 'normal' may be explained. For it has been reported that during passive self-motion with velocities below normal walking speed, displacement is overestimated, whereas at normal walking speed estimates are more veridical (Mittelstaedt and Glasauer, 1991, see also chapter 5 of this thesis). In condition LA maximum velocity was close to normal walking speed, whereas in condition HA maximum velocity was below normal walking speed. It follows that the visual/proprioceptive ratio of 1.5 in conditon HA reflects the overestimation of proprioceptively perceived displacement.
The fact that subjects were able to discriminate the proprioceptive stimulus from the visual stimulus in the A conditions may also explain why motion of the visual environment was almost never reported. For the fact that subjects are able to perceive the two motion stimuli independent from each other, may imply that the two stimuli are not integrated by the perceptual system to form a percept of self-motion. Which is another way of saying that we did not manage to simulate self motion convincingly. And it seems fair to assume that a necessary condition to perceive motion of the environment is, that the perceived self-motion does result in the integration of the visual and proprioceptive stimuli. For in order to obtain a percept of surround motion, the visual system one needs an earth stable reference. Such a reference is created as a result of visual/ proprioceptive interaction (see Wertheim, 1994). If the visual and proprioceptive stimuli are not integrated by the perceptual system, it is probable that the two are not allowed to interact in that manner. This lack of interaction may also explain why the range of Stimulus Ratios that was perceived as 'normal' in the A conditions was small. That is, the visual stimuli did not seem to dominate the proprioceptive stimuli. Visual domination is, just as motion of the surrounds, an effect resulting from the interaction of visual an proprioceptive stimuli. Therefore, if the two are not integrated, visual domination becomes less plausible.
In the Ph conditions, so it seems, the visual and proprioceptive stimuli did interact in order to form one self-motion percept. Subjects were hardly ever capable of pointing out what it was that was strange about their 'strange' percepts. They seemed truly disoriented and often experienced their motion as very unpleasant, as was reported above. In addition, motion of the environment was reported by half of them at some stage.
Apparently introducing a phase difference between visual and proprioceprive stimuli robs the system of its ability to separate the two inputs. The result is an integrated self-motion percept, which, when meddled with, leads to disorientation, motion sickness and finally, perceived motion of the environment. In conclusion: it seems that, with the stimuli used in this experiment, in-phase visual/proprioceptive stimuli are not convincingly integrated by the perceptual system to form one self-motion percept, whereas introducing phase shifts does lead to one integrated self-motion percept.
The Ph conditions produced an assymetry in group average N-scores between phase lags and phase leads ( phase-leads are tolerated more than phase-lags). The maximum 'normal' score seems to lie somewhere between a 0 deg and a 10 deg phase-lead. This may reflect a small phase-lead of the otolith response, as predicted by a model of Grant and Best (1987), for the used frequencies. On the other hand that would imply that the subject matches the visual stimulus to the proprioceptive stimulus in the Ph conditions just as in the A conditions. As argued above this does not stroke with the results.
Another explanation stems from the fact that vision gives the perceptual system a chance to look ahead. It gives the perceptual system an 'expectation' of what is coming. When the proprioceptive motion lags the visual motion, the proprioceptive motion is late but has been expected. But when the proprioceptive motion leads the visually expected motion, the discrepancy is much bigger. A motion 'unexpected' by the visual system is sensed. As a result visual lead may be more acceptable to the perceptual system than visual lag.
To add subjects to the Ph conditions (which only 5 subjects completed) and with the wish to try to create an integrated self-motion percept in the A conditions, the experiment was replicated. Experiment 2 differs from experiment 1 in the simulated visual environment. The illusion of a never ending corridor was created to replace the room of the present experiment. The rationale behind this new virtual environment was that it would expand the visually induced 'expectation' of possible displacement amplitudes. Subjects were asked to 'forget' that they had seen the length of the rail of the sled and to 'believe' that their displacement amplitude could be of any length. The idea was to keep subjects from separating the visual stimulus from the proprioceptive stimulus.
Experiment 2
Linear horizontal self-motion perception in a virtual corridor
Method
10 paid naive subjects (aged 18-29 yrs) were selected, again on the basis of their own account of not being susceptible to motion sickness. None of them had participated in experiment 1. They gave their informed consent and were free to withdraw at any time.
The set-up was similar to that in Experiment 1, except for the simulated visual environment. The simulated environment was an endless corridor, mimicking and dimensioned after a real corridor in our laboratory. The corridor has doors on both sides 3.6m apart and the doors on the right hand side are recessed in the wall by 0.5m. The width of the corridor is 2.0m and its height is 2.5m. The floor, the walls and the ceiling of the virtual corridor consisted of structured patterns, which offered a rich visual flow (Fig. 7).
figure 7: The virtual corridor as seen by the subject
The same 4 conditions (HA, LA, HPh and LPh) as in experiment 1 were presented (see Tables 1 and 2 above) and the same range of Phase differences and Stimulus Ratios was used. This time however, because of the much greater length of the virtual environment it was possible to present the same range of Stimulus Ratios in the LA condition as in the HA condition: 0.25, 0.5, 1.0, 1.5, 2.0, and 3.0 (p-p displacements of the visual stimulus: 0.8, 1.6, 3.2, 4.8, 6.4, and 9.6m respectively).
In Experiment 1 the Ph conditions caused much motion sickness. Therefore in this experiment the stimuli of conditions HPh and HA, and of conditions LPh and LA, were mixed pseudo randomly into 20 minute measurement sessions (H sessions and L sessions). In this manner the number of Phase shifts presented in one measurement session was halved. In addition the experimenter could switch to presenting a Stimulus Ratio (a less provocative stimulus) next, if the subject reported malaise.
As will become clear in the result section, the Stimulus Ratio that was perceived as normal was often greater than 1. Therefore, before presenting a Phase shift or a small series of Phase shifts, the Stimulus Ratio was set at a ratio that was perceived as 'normal' by the subject. Consequently a measurement session of a particualr subject always started with a series of Stimulus Ratio presentations in which the ratio with the highest 'normalcy' was searched.
Subjects were asked to 'forget' the actual length of the sled's rail and to imagine that any displacement amplitude was possible since they were actually sitting in an endless corridor.
To obtain more detailed information about the severeness of the motion sickness experienced during measurement sessions, subjects were asked to fill out a motion sickness rating scale after each session or premature stop. This so called MIsery SCale (MISC) (Wertheim et al., 1992) consists of two parts. Only the scores of the first part, which is an 11 point rating scale, running from 0 (no problems) to 10 (vomitting), are discussed here.
Results
Motion Sickness
Despite the fact that subjects were selected on their own account of not being susceptible to motion sickness, and despite the mixing of the A and Ph conditions, half of the subjects suffered badly from motion sickness (symptoms ranging from nausea to retching). All but one subjects experienced at least one symptom of motion sickness. The highest scores on the MISC for subjects 1 to 10 were 3, 5, 3, 8, 7, 3, 9, 6, 0 and 3 respectively. Because of the mixed measurement sessions it is difficult to determine which conditions were experienced as the most provocative. Nevertheless, it is our strong impression that, as in experiment 1, the Ph conditions were the most provocative. For instance, when subjects quit prematurely, this was almost always during a large Phase shift presentation or after a small subseries of Phase shift presentations.
There seemed to be no difference in provocativeness between H and L conditions: some subjects suffered more during L conditions whereas others suffered more from H conditions. Altogether, only nine subjects were able to finish the A conditions, whereas only six subjects finished the Ph conditions with enough measurements to be incorporated in the data analysis.
A conditions
The individual N- and S-scores are shown in Fig. 8, and the group mean N- and S-scores are shown in Fig. 9.
The figures shows a marked difference with figures 3 and 4 above, which depict the A conditions of experiment 1. Whereas in experiment 1 the average maximum N-score of condition HA was situated at a Stimulus Ratio of 1.5, in experiment 2 it is situated at the highest Stimulus Ratio presented, which was 3. In addition the climb from the minimum N-score to the maximum is not as steep in this experiment. In condition LA the maximum N-score is situated at a Stimulus Ratio of 1, as in experiment 1. But the decline over the next 3 Stimulus Ratios is much less steep and doesn't truly begin until above a Ratio of 2.
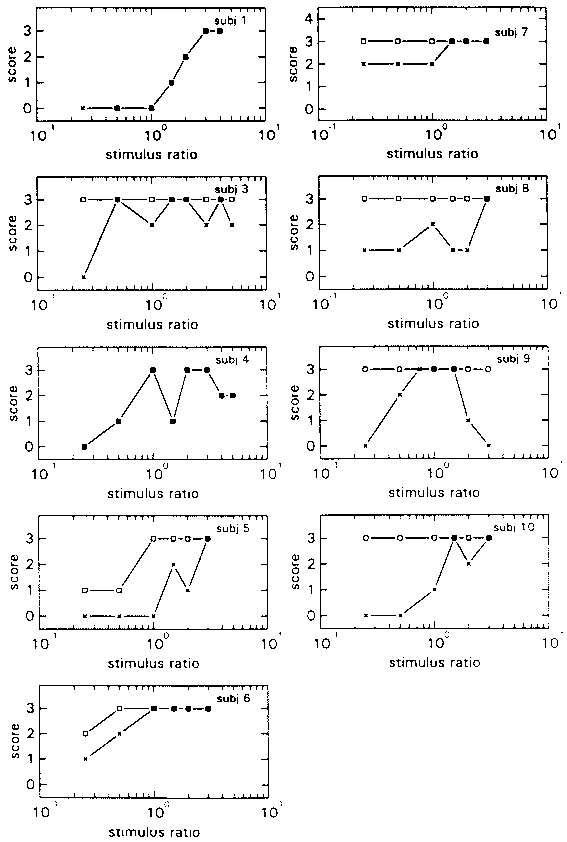
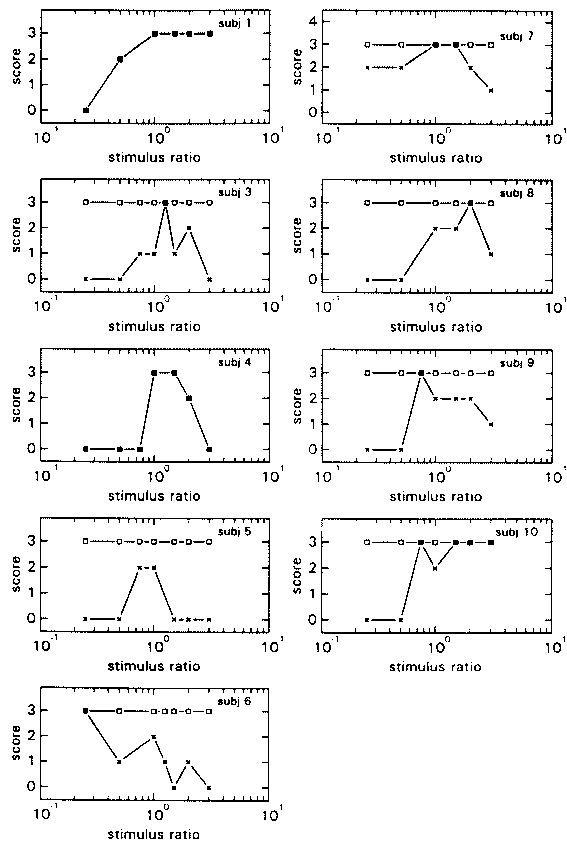
figure 8: Individual N-scores (x) and S-scores (R), in the HA blocks
(a) and LA blocks (b), plotted as a function of stimulus ratio of the various
stimulus combinations. N-scores vary from 0 (there was always something abnormal)
to 3 (everything was always normal); S-scores also vary from 0 (the virtual
room was never perceived as stable) to 3 (it was always perceived as stable).
figure 9: Group mean N-scores (x) and S-scores (R), in the HA blocks (upper panel) and LA blocks (lower panel), plotted as a function of the p-p displacement of the visual stimulus in the various stimulus combinations. N-scores vary from 0% (there was always something abnormal) to 100% (everything was always normal); S-scores also vary from 0% (the virtual room was never perceived as stable) to 100% (it was always perceived as stable).
The individual S-scores (fig 8), reveal more motion of the environment in experiment 2 than in experiment 1 (fig 3), especially in condition HA ( 4 subjects as opposed to 2 subjects in condition LA).
As in experiment 1, subjects were often able to inform the experimenter on what caused their motion percept to be 'strange'. They perceived which of the two stimuli (visual or proprioceptive) was bigger or smaller than the other.
HPh and LPh subconditions
In the Ph subconditions results from experiment 1 were quite well replicated. The individual N- and S-scores are shown in Fig. 10, the group mean scores in Fig. 11. The N-scores show a similar shift of the tolerance towards a phase lead as was found in experiment 1. Motion of the environment as reflected in the S-scores seems to have been reported more in this experiment than in experiment 1 (compare figs 5 and 10) and slightly more so in condition HPh.
figure 10: Individual N-scores (x) and S-scores (R) in the HPh (left) and LPh (right) subconditions, as a function of the phase shift of the visual stimulus relative to the proprioceptive stimulus. N-scores vary from 0 (there was always something abnormal) to 3 (everything was always normal); S-scores vary also from 0 (the environment was never perceived as stable) to 3 (the environment was always perceived as stable).
figure 11: Group mean N-scores (x) and S-scores (R) in the HPh (upper panel) and LPh subconditions (lower panel), as a function of the phase shift of the visual stimulus with respect to the proprioceptive stimulus. N-Scores vary from 0% (there was always something abnormal) to 100% (everything was always normal); S-scores vary also from 0% (the environment was never perceived as stable) to 100% (the environment was always perceived as stable).
Discussion
In experiment 2 the virtual environment was changed from a room with a fixed end (experiment 1) to an endless corridor, combined with the instruction to 'forget' the actual length of the sled's rail. This change in the set-up seems to have had no effect on the results from the Ph conditions. The data of experiment 1 were replicated and showed a similar tolerance for phase lead as opposed to phase lag.
The different visual stimulus did produce quite a different set of results in the A conditions. Motion of the environment was reported more often. In addition visual dominance revealed itself through a less steep rise of the N-scores below the Stimulus Ratio at which the maximum was found (condition HA) and a less steep decline of the N-scores above the Stimulus Ratio at which the maximum N-score was found (condition LA). It thus seems possible that this new visual stimulus produced a better integration of the visual and the proprioceptive stimuli of the A conditions, into one self-motion percept. The fact that more instability of the environment was reported in the Ph conditions as well, may confirm this.
On the other hand, subjects were still able to clarify their 'strange' percepts in the A conditions and in that sense were not truly disoriented. Nor did they seem susceptible to motion sickness during the A conditions. The results indicate that a difference in amplitude between visual and proprioceptive stimuli is not as provoking as a difference in phase.
An explanation of this may be possible according to a model on the Subjective Vertical (SV) proposed by Bos and Bles (1997). The model states that when the SV derived from sensory stimulation conflicts with the 'expected' SV (based on visual and cognitive information), one becomes disoriented and motion sick. In the model the vector difference between the expected SV and the actual SV is calculated. And it predicts that the bigger this difference is, the bigger is the chance that one becomes motion sick. Thus, a big phase difference between visual and proprioceptive stimuli produces a big vector difference, because of the discrepancy between the ‘visually’ expected SV and the sensed SV.
This explanation only holds if one assumes that the direction of the expected SV changes during a horizontal visual motion stimulus, even though one can see that the motion path is horizontal. In addition, the model would also predict that very big amplitude differences provoke a lot of motion sickness, which was not the case.
Therefore it is perhaps more plausible that it is the changing GIF vector and not the SV that causes the motion sickness in this experiment. Similar to the reasoning of Bos and Bles motion sickness may then be the result of a direction conflict between the expected sinusoidal motion of the GIF (Gravito Inertial Force) vector, based on the ‘Internal Model’ (Henn et al., 1980) and the actually perceived motion of the GIF vector. The expected direction of the GIF vector may be based more on the visual stimulus (since one can ‘look ahead’), whereas its actual direction may be more determined by the proprioceptive stimulus acting on the inertial sensors. When there is a phase difference between visual and proprioceptive stimuli, at certain moments of the self-motion, the expected and actual GIF vectors may thus be pointing in opposite directions with respect to gravity. With amplitude differences the two would always be pointing in the same direction with respect to gravity.
In line with our observation that visual/proprioceptive phase differences are apt to generate motion sickness, are reports that increasing the visual delay in flight-simulators has an increasingly detrimental effect on flight performance, both in fixed base simulators and also in moving base simulators, albeit to a lesser degree (see e.g. Wildzunas et al. 1996 for a recent review).
Thus, a change in visual stimulus and instruction seemed to have an effect on the quality of the self-motion percept in the A conditions but not in the Ph conditions. This, combined with the preferance of the percepual system for visual phase leads, suggests that the quality of perceived self-motion in a virtual environment of the kind used here, is higher when a slight phase lead of the visual stimulus in relation to the proprioceptive stimulus is introduced. A preference for visual lead on proprioceptive stimuli has been reported earlier for pilot performance in flight simulators (i.e. Michell et al. 1992).
Apart from an increase in visual dominance and reports of surround motion in the A conditions, the Stimulus Ratios at which the highest N-score was found differed from experiment 1 as well. This was especially so in the HA condition in which the maximum moved from a ratio of 1.5 (experiment 1) to a ratio of 3 (experiment 2). Since 3 was the highest stimulus ratio that was presented, it is possible that the true maximum lies at an even higher ratio. In condition LA the maximum N-score was found at a Stimulus Ratio of 1 in both experiments. However, the top of the graph depicting the N-scores in figure 9 is rather flat. Therefore it is not unthinkable that the true maximum lies a bit more to the right, somewhere between a ratio of 0.75 and a ratio of 2. Whether the difference between the conditions is an effect of frequency or of amplitude remains undecided at present.
The difference with experiment 1 may have been caused by the disappearance of some strong distance cues in the latter exepriment. There was no wall facing the subject and there was no workstation at a clearly defined distance. Perhaps this resulted in an underestimation of visual displacement amplitudes. Another possibility is that subjects do not experience vection as a result of the visual stimulus until it reaches a maximum velocity of 2.5 m/sec. This is the velocity of the Stimulus Ratio at which the maximum N-scores are found in both conditions.
The latter possibility is examined in the following experiment in which the visual motion stimuli are presented without the proprioceptive stimuli. In addition, the A conditions of experiment 2 are replicated at Stimulus Ratios of 1 and higher in order to locate the true maximum N-scores. Furthermore, an amplitude condition is added in which N- and S- scores are measured for 5 different amplitudes of the proprioceptive stimulus, whilst keeping the frequency constant.
Experiment 3
Moving through a virtual corridor at larger ranges of amplitude, acceleration and frequency
Method
10 paid naive subjects (aged 19-53 yrs) were selected, based on their own account of not being highly susceptible to motion sickness. None of them had participated in the earlier experiments. They gave their informed consent and were free to withdraw at any time.
The set-up was similar to that in experiment 2 and the same sled frequencies and amplitudes were used for conditions HA and LA. The Stimulus Ratios presented in condition HA and LA were: 1, 2, 4, 8 and 16 (in HA: p-p visual displacements of 0.8, 1.6, 3.2, 6.4 and 12.8; in LA: 3.2, 6.4, 12.8, 25.6 and 51.2m respectively).
In the third condition, the Constant frequency Amplitude condition (condition CA), 5 sled motion profiles with a frequency of 0.16 Hz were used, each with a different amplitude. Within each of these, 7 different Stimulus Ratio's were used: 0.25, 0.5, 1, 2, 4, 8 and 16.
Table 5 Sinusoidal motion profiles as used in condition VC for the proprioceptive stimulus
|
freq. 0.16 Hz |
acceleration |
velocity |
p-p displacement |
|
profile a |
0.01 g |
0.10 m/s |
0.20 m |
|
profile b |
0.02 g |
0.20 m/s |
0.40 m |
|
profile c |
0.04 g |
0.40 m/s |
0.80 m |
|
profile d |
0.08 g |
0.80 m/s |
1.60 m |
|
profile e |
0.16 g |
1.60 m/s |
3.20 m |
Finally, three control conditions were added in which the sled did not move at all. The visual stimuli from conditions HA (0.36 Hz), LA (0.18 Hz) and CA (0.16 Hz) were presented and tested on their ability to induce vection. The conditions will be referred to as conditions H0, L0 and C0. In each control condition visual stimuli with 6 different displacement amplitudes were presented: 0.20, 0.40, 0.80, 1.60, 3.20 and 6.40m for condition H0; 0.80, 1.60, 3.20, 6.40, 12.8 and 25.6m for condition L0 and 0.10, 0.20, 0.40, 0.80, 1.60, 3.20 and 6.40m for condition C0.
The visual stimuli of the 0 conditions were presented mixed and in random order in 20 minute measurement sessions. All the 0 conditions were performed before the first A conditions.
In contrast to experiment 2, the sled's motion was stopped for about one minute in between every stimulus presentation. In all other respects the present experiment was similar to experiment 2.
Results
Motion Sickness
Three subjects (4, 7 and 8) reported symptoms of motion sickness and one subject (1) quit the experiment prematurely because of motion sickness.
Conditions LA and HA were found to be the only conditions to have a certain provocative nature.
It is noteworthy that the three subjects suffering from motion sickness were the only subjects, who had N-scores of 3 at rather high Stimulus Ratios in every A condition.
Conditions HA and LA
Interindividual differences were similar to those found in experiment 1 and 2. The group mean scores are shown in Fig. 12.
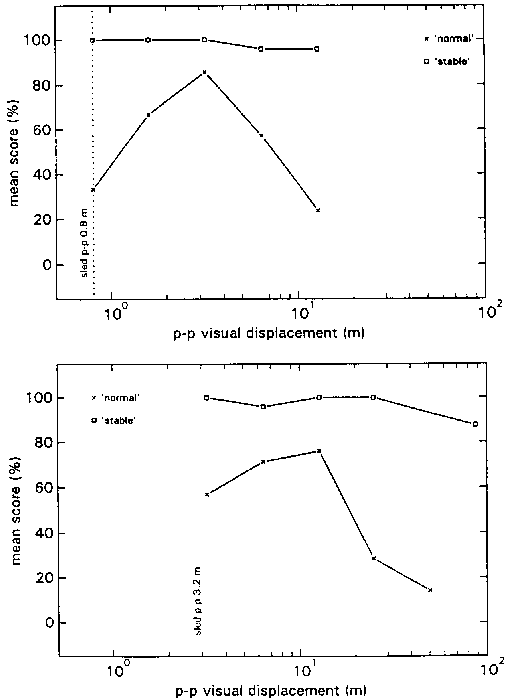
figure 12: Group mean N-scores (x) and S-scores (R), in the HA blocks (upper panel) and LA blocks (lower panel), plotted as a function of the visual p-p displacement in the various stimulus combinations. N-scores vary from 0% (there was always something abnormal) to 100% (everything was always normal); S-scores also vary from 0% (the virtual room was never perceived as stable) to 100% (it was always perceived as stable).
The maximum average N-score in condition HA is situated at a Stimulus Ratio of 4. At higher ratios the N-score decreases gradually. Combining these data with the data of experiment 2 (fig 9) yields a gradual climb of the N-score from Stimulus Ratio 0.25 to the maximum at Stimulus Ratio 4, after which it gradually decreases. Motion of the environment, as reflected by the S-scores, was not often reported.
The maximum average N-score in condition LA is situated at a Stimulus ratio of 4 as well. A rather steep decline is revealed at higher ratios, whereas there is hardly any decline from Stimulus Ratio 4 to 1. This rather flat top is similar to the data of experiment 2 (fig 9), but it is situated more to the right. In experiment 2 a Stimulus Ratio 3 yielded an average N-score of only 30%, whereas in the present experiment it yields an N-score of nearly 80%. Thus, combining the 2 figures leads to a descrepancy at that point. Nevertheless, the overall picture that arises from both experiments is similar: a steep rise from Stimulus Ratio 0.5 to a plateau which lies somewhere between Stimulus Ratios 0.75 and 4, followed by a steep decline again.
Again most of the subjects were able to point out whether the visual stimulus was bigger than the proprioceptive stimulus or the other way around.
Condition CA
In condition CA inter-individual differences were considerable again, but the intra-individual responses at the different stimuli, seemed to be consistent with each other. The group mean scores for each profile are depicted in fig 13.
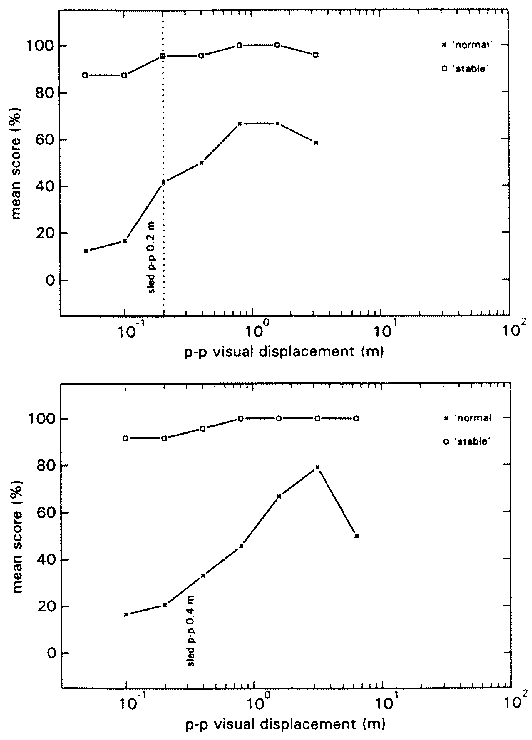
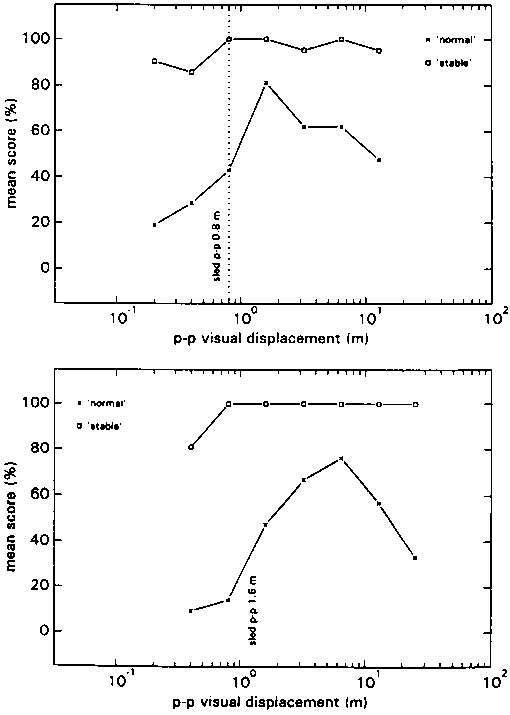
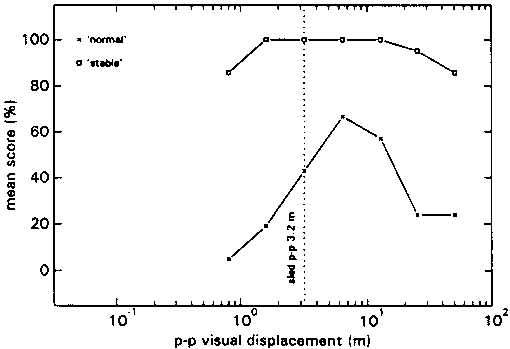
In all profiles the average maximum N-score was situated at Stimulus Ratios varying from 2 to 8. According to the S-scores: if motion of the environment was reported, this was at ratios below 1 most of the time.
As in all the previous A conditions subjects were able to point out to the experimenter what it was that was 'strange' about their percept.
In fig 14 the N-scores for all profiles are depicted 3 dimensionally as a function of the acceleration amplitude of the proprioceptive stimuli and the acceleration amplitude of the visual stimuli. Since the difference in frequency between condtions LA and CA is quite small, we included the data of condition LA in the figure as well. A least square fit was fitted through the data.
figure 14: Group mean N-scores as a function of the maximum acceleration of the proprioceptive stimulus (LOGPROPA) and the maximum acceleration of the visual stimulus (LOGVISA) in all stimulus presentations of the LA and CA blocks. N-scores vary from 0% (there was always something abnormal) to 100% (everything was always normal). a and b reflect two opposite side views of the same graph (see inverted scales). c reflects top view (lines reflect altitude in terms of equal N-score values).
The width of the least square fit in figure 14 decreases when the maximum acceleration of the proprioceptive stimulus increases (most clearly illustrated in Fig 14c). Thus, the range of Stimulus Ratios that are experienced as 'normal' seems to narrow when the amplitude of the proprioceptive stimulus increases. In addition the slope of the top ridge of the graph in figure 14c is smaller than 1. Thus, when the proprioceptive amplitude increases, maximum N-scores (along the top ridge) occur at lower visual/proprioceptive ratios (closer to 1).
0 conditions
In figure 15 the group average N-scores for conditions H0, V0 and C0 are depicted as a function of the acceleration amplitude. In the 0 conditions a 100% N-score should be interpreted as saturated vection.
figure 15: Group mean N-score as a function of maximum visual stimulus acceleration in all subconditions of the L0 (o), the H0 (x) and the C0 (+) control conditions. N-scores vary from 0% (there was always something abnormal) to 100% (everything was always normal).
For all 0 conditions the N-scores peak at acceleration amplitudes below 0.1g. The S-scores (not depicted) reveal that motion of the environment was often perceived and thus that vection was often not saturated.
figure 16 a: Group mean N-scores for the subconditions with equal visual acceleration as contained within the CA block, as a function of the visual/proprioceptive stimulus ratio. Plus signs, crosses, open circles, closed circles, open squares, closed squares and triangles correspond to 0.1, 0.2, 0.4, 0.8, 1.6, 3.2 and 6.4 m/s, respectively.
figure 16 b: Group mean N-scores for all subconditions in the C0 control condition, as a function of their maximum visual acceleration. Same symbols as in A.
N-scores vary from 0% (there was always something abnormal) to 100% (everything was always normal)
In figure 16A the data of condition CA are depicted as a function of the visual/proprioceptive stimulus ratio. Each separate curve depicts a constant visual acceleration amplitude. In figure 16B the corresponding C0 control data from fig 15 are depicted again. The symbols depicting the different acceleration amplitudes are the same in both figures. Thus, average N-scores can be compared between simulated motion with (A) and without (B) proprioceptive support. Doing this it can be deduced that on average, at acceleration amplitudes of 0.08 g and higher, self-motion percepts became more veridical when a proprioceptive stimulus was added.
Discussion
Only three subjects reported motion sickness in this experiment and only in conditions LA and HA. Thus the hypothesis that phase differences between visual and proprioceptive stimuli are more provocative than amplitude differences is confirmed, since in this experiment only amplitude differences were presented. The fact that in condition CA motion sickness was never reported must be related to the relative low accelerations that were used in this condition. Acceleration amplitudes in condition CA were all below the 0.2 acceleration amplitude used in conditions HA and LA. Higher motion sickness incidence with higher accelerions is in accordance with Golding et al. (1996) and with the afore mentioned model by Bos and Bles (1997).
In all A conditions presented in this experiment the group average N-scores have their maximum at visual/proprioceptive stimulus ratios above 1 (between 1 and 8). This is a surprising finding, for it means that when the visual and proprioceptive stimuli equaled each other - and thus supposedly mimicked everyday experience - veridicality was below maximum.
Condition CA revealed that the ratio which is perceived as veridical decreases towards 1 when the amplitude of proprioceptive motion increases. Therefore it is plausible that at amplitudes above 0.2g (the maximum amplitude that was used), the ratio will eventually become 1. In addition the range of ratios that yields high N-scores becomes smaller with higher proprioceptive motion amplitudes. Thus, with higher proprioceptive motion amplitudes, visual/proprioceptive combinations were judged more correctly and with more certainty.
The overestimation of passive displacement at velocities below walking speed that was mentioned before (Mittelstaedt and Glasauer, 1991; see also chapter 5 of this thesis) may in part explain why lower proprioceptive stimuli need to be combined with higher visual stimuli in order to obtain a veridical percept of self-motion. But visual stimuli with displacements 8 times that of the proprioceptive displacement, far exceed the overestimations of displacement mentioned in those papers.
Also, in the previous chapter the point has been made that in the perception of linear horizontal motion 'expectations' and 'mental set' play a role. Subjects were aware of the fact that the visual and proprioceptive stimuli were varied relative to each other in the experiment. This knowledge in itself may have caused a deviation from what is expected according to normal everyday experience. In addition the lower velocity amplitudes measured are in the range of active everyday motion (i.e. walking), whereas higher amplitudes (connected with accelerations above 0.2 g) are more in the range of passive everyday motion (i.e. riding on trains, trams and cars). Thus the passive linear motion system may be more familiar with higher accelerations and therefore more exact in this range.
From the 0 conditions it may be concluded that the visual stimuli that were used in the A conditions were able to induce vection, but only at acceleration amplitudes below 0.08 g. Conditions CA and C0 combined, showed that above 0.08 g the quality of the self-motion percept improved when a certain amount of proprioceptive stimulation was added. That simulated motion gains in quality from proprioceptive support was reported earlier by Hosman (1997).
When compared to experiment 2, there seemed to be less reports of sorround motion in conditions HA and LA of this experiment. This may be the result of the fact that only Stimulus Ratios of 1 and higher were measured in these conditions in this experiment. As can be seen in figure 14 and also figure 9, the amount of reports of surround motion seems higher at Stimulus ratios below 1 (reflected in lower S-scores). Apparently a proprioceptive stimulus that exceeds the visual stimulus is less acceptable than when it is the other way around. That conclusion coincides with the N-score data that were discussed above.
The N- and S-score data of all 3 experiments reveal a rather big distance between first reports of disorientation and first reports of surround motion. Thus, even though the perceptual system is aware of the fact that something strange is going on, it shows a preference to hold on to a stable visual surround. In other words, there seems to be a serious reluctance of the perceptual system to give up percepts of surround stability. This is in agreement with the proposition of Wertheim and Bles (1984) (see also Wertheim 1994), that the JND (Just Noticable Difference) between retinal signals (encoding retinal image motion) on the one hand, and reference signals (encoding information about self motion, stemming from proprioceptive and indirect optic information) on the other hand, is quite big (about 40% of the magnitude of the signals). Instability of the visual surround is perceived when the magnitudes of retinal and reference signals differ by more than one JND. A big JND therefore results in a high tolerance of the perceptual system for differences in magnitude between the two signals. A big JND is usefull to the perceptual system because the frequency response to visual and vestibular stimulation is not the same. As a result the rate of development of vestibular and visual components within the two signals is not equal. Consequently, without big JNDs, differences in magnitude between retinal and reference signals would occur relatively often, which would result in percepts of a moving environment.
Conclusions
Note that the following conclusions all regard combinations of visual and proprioceptive passive linear horizontal self-motion stimuli at frequencies of 0.16 to 0.36 Hz with proprioceptive acceleration amplitudes of 0.01 g to 0.2 g.
- Phase differences between visual and proprioceptive stimuli were more disorienting and induced more motion sickness than Amplitude differences. In addition high accelerations seemed to induce more motion sickness than low accelerations. These results are explained as a direction conflict between the proprioceptively sensed change in the GIF vector and the expected (visual) change in the GIF vector, or possibly, the difference between the sensed and expected SV’s (Bos and Bles 1997).
- During in-phase motion of visual and proprioceptive stimuli an endless virtual corridor combined with an 'open mind' instruction resulted in one integrated self-motion percept. A small virtual room with a clear end and no special instruction resulted in seperate percepts of proprioceptive and visual motion, and thus no integrated percept of self-motion.
Phase differences between the visual and proprioceptive stimuli resulted in one integrated percept of self-motion with both virtual surrounds. In addition, phase leads of the visual stimulus resulted in more veridical percepts of self-motion than phase lags.
Combining these results it seems that motion percepts in virtual surrounds gain in quality when a small lead of the visual stimulus is introduced (see also Mitchell et al. 1992).
- Low amplitude proprioceptive stimuli result in the most veridical percepts of self-motion when they are combined with visual stimuli of a higher (1.5 to 8 times higher).
The ratio of visual/proprioceptive stimuli that is judged as most veridical decreases with an increase in the amplitude of the proprioceptive stimulus. In addition the uncertainty with respect to the most veridical stimulus also decreases with an increase in the amplitude of the proprioceptive stimulus.
Conclusively, adding a relatively small proprioceptive stimulus to a visual self-motion stimulus is 'safer' than adding a proprioceptive stimulus that almost equals the visual stimulus.
- The previous conclusion brings with it the fact that proprioceptive stimuli that exceed the visual stimulus lead to more disorientation than when it is the other way around.
- Visual stimuli without proprioceptive stimuli may yield vection with acceleration amplitudes up to 0.08 g. With higher acceleration amplitudes the quality of the self-motion percept improves when proprioceptive stimulation is added (see also Hosman, 1997; Mitchel et al, 1992).
- It takes much bigger visual/proprioceptive differences to induce perceived motion of the environment than it takes to induce a feeling of disorientation. Thus, the perceptual system seems reluctant to give up a stable world. This is explained by big JND’s (Just Noticable Differences) between perceived self-velocity and retinal velocity of the world, before motion of the world is perceived (see Wertheim and Bles, 1984).
References
Berthoz A., Pavard B., Young L.R. (1975) Perception of Linear horizontal Self Motion Induced by Peripheral Vision (Linearvection): Basic Characteristics and Visual-Vestibular Interactions. Experimental Brain Research. 23: 471-489.
Pavard B. and Berthoz A. (1977) Linear acceleration modifies the perceived velocity of a moving visual scene. Perception 6, 529-540.
Bles W., Vianney de Jong J.M.B. (1982) Cervico-vestibular and visuo-vestibular interaction. Acta otolaryngol. 94, 61-72.
Carpenter-Smith T.R., Futamura R.G., Parker D.E. (1995) Inertial accleration as a measure of linear vection: An alternative to magnitude estimation. Perception & Psychophysics. 57(1), 35-42.
Dichgans J., Brandt Th. (1972) Visual-vestibular interaction and motion perception. Bibl.ophthal. 82, 327-338.
Golding J.F., Markey H.M. (1996) Effect of frequency of horizontal linear oscillation on motion sickness and somatogravic illusion. Aviation Space and Environmental Medicine. 67, 121-126.
Grant J.W. and Best W. (1987) Otolith-organ mechanics: Lumped parameter model and dynamic response. Aviat. Space and Environm. Med. 58, 970-976.
Guedry F.E. (1974) Psychophysics of vestibular sensation. In: Handbook of Sensory Physiology (Kornhuber H.H. ed.) Springer Verlag Berlin, New York, Vol. VI/2, 3-154.
Lee J.R., Lishman D.N. (1973) The autonomy of visual kinaesthesis. Perception 2, 287-294.
Mitchell D.G., Hoh R.H., Atencio Jr. A., Key D.L. (1991) The use of ground based simulation for handling qualities research: a new assessment. AGARD conference proceedings. Agard-CP-513, 23/1-23/14.
Mittelstaedt M., Glasauer S. (1991) Idiothetic navigation in gerbils and humans. Zool. Jb. Physiol. 95, 427-435.
Reason and Brandt (1978) Motion Sickness. Academic Press, London, New York, San Fransisco, A subsidiary of Harcourt Brace Jovanovich, Publishers.
Soons A.F.L., Burden D.F., Garvin M.J. and Wyn-Roberts D. (1981) A European facility for life-science experiments in Spacelab. ESA Journal, Vol. 5, 99-108.
Werkhoven P.J. and Kooi F.L. Spacial perception in a virtual operations room. Effects of field of view, stereoscopic vision and feedback delay. Reportnr. TNO-TM 1994 A-53 (in dutch), TNO Human Factors Research Institute, Soesterberg, the Netherlands.
Wertheim A.H. (1994) Motion perception during self-motion: The direct versus inferential controversy revisited. Behavioural and Brain Sciences 17, 293-355.
Wertheim A.H. and Bles W. (1984) A revaluation of cancellation theory: Visual, vestibular and oculomotor contributions to perceived object motion. Report IZF 1984-8, Soesterberg, NL: TNO Human Factors Research Institute.
Wertheim A.H., Ooms J., de Regt G.P. and Wientjes C.J.E. (1992) Incidence and severeness of seasickness: validation of a rating scale. TNO Report IZF 1992 A-41, TNO Human Factors Research Institute, Soesterberg, the Netherlands.
Wildzunas R.M., Barron T.L., Wiley R.W. (1996) Visual display delay effects on pilot performance. Aviation Space and Environmental Medicine. 67, 214-221.
Young L.R., Dichgans J., Murphy R., Brandt Th. (1973) Interaction of optokinetic and vestibular stimuli in motion perception. Acta Otolaryng. 76, 24-31.
Young L.R. and Henn V. (1974) Selective habituation of vestibular nystagmus by visual stimulation. Acta Otolaryngol. 77, 159-166.
Young L.R., Oman C.M., Dichgans J.M. (1975) Influence of head orientation on visually induced pitch and roll sensation. Aviation Space and Environmental medicine. 46(3), 264-268.